Stats Screens in the Spotlight: Poker HUDs Decode Online Opponent Tells
Stats Screens in the Spotlight: Poker HUDs Decode Online Opponent Tells
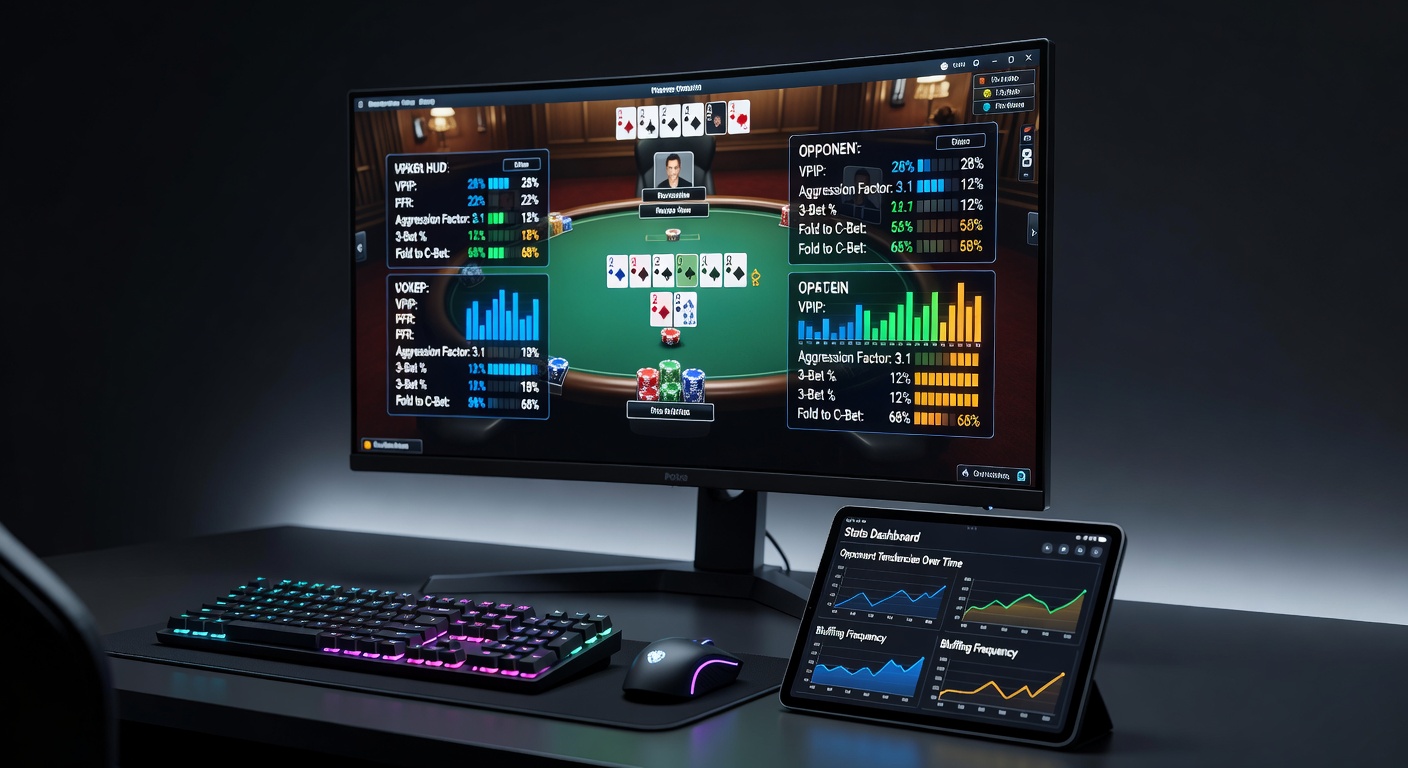
Online poker tables buzz with activity, yet beneath the rapid clicks and bets, tools like Heads-Up Displays—or HUDs—silently compile mountains of data on every opponent, transforming raw hand histories into revealing stats screens that expose playing styles in real time.
Players who dive into multi-table tournaments or cash games quickly discover these overlays; they pop up right on the poker client, color-coding seats with metrics pulled from thousands of prior hands, so a loose-aggressive foe lights up red while a tight nit fades to blue, all without pausing the action.
What Exactly Are Poker HUDs and Stats Screens?
HUDs emerged in the early 2000s as software add-ons for platforms like PokerStars and partypoker; developers at companies such as PokerTracker crafted them to track hand data automatically, pulling info from the poker room's logs and building databases that update live during play.
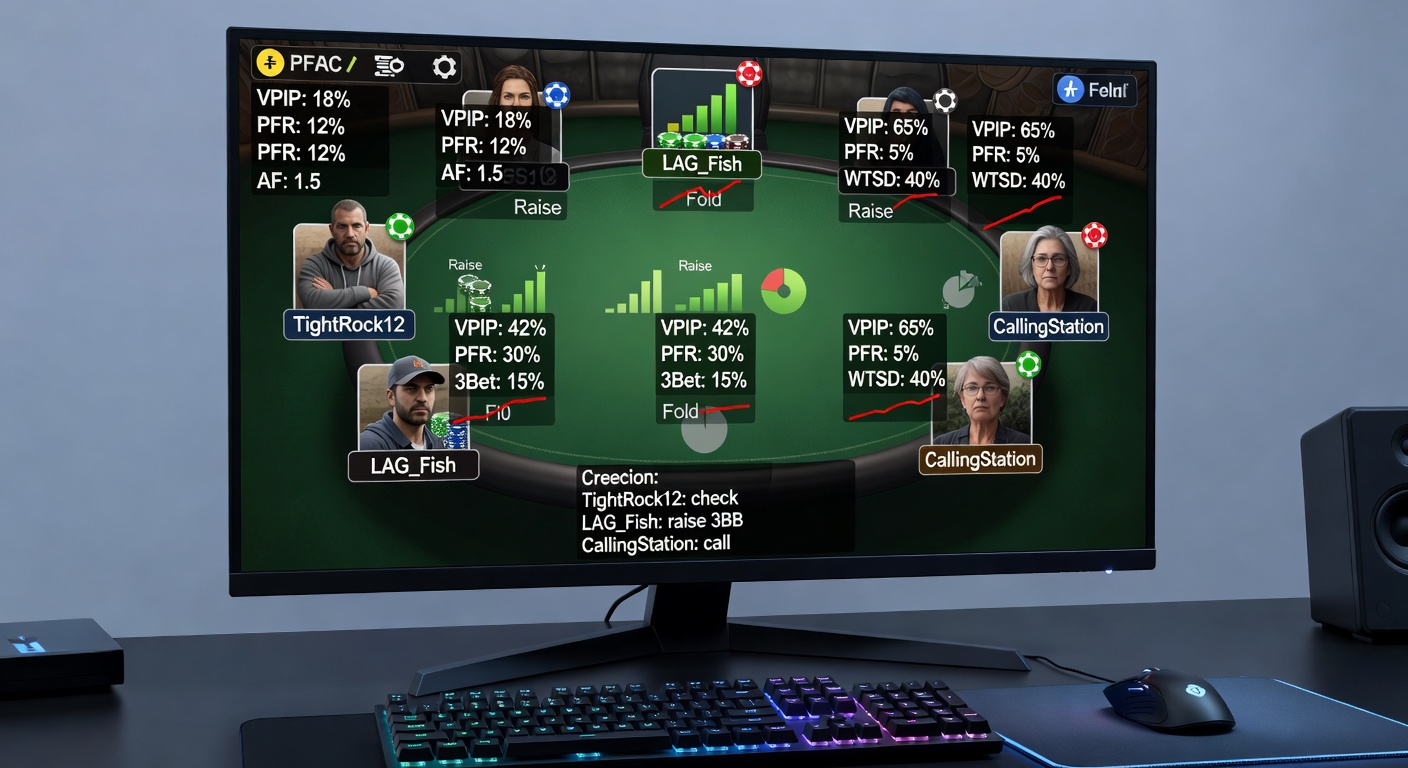
Stats screens, the core of any HUD, display key figures next to each player's avatar—think VPIP for voluntarily put money in pot, hovering around 20-25% for solid players but spiking over 40% for maniacs—while PFR, or preflop raise percentage, pairs with it to flag those who limp too often or over-fold to steals.
And here's where it gets interesting: these aren't static charts; modern HUDs in April 2026 integrate dynamic popups, where hovering over a stat reveals graphs of aggression factor over the last 100 hands, showing how a villain ramps up bluffs on the river but clams up postflop.
Core Stats That Paint the Picture
Experts who analyze thousands of sessions point to VPIP/PFR as the foundation; data from PokerTracker reveals typical ranges, with winning players at 18-25% VPIP and 15-20% PFR in no-limit hold'em, whereas fishy types exceed 30% on both, leaking chips through loose calls.
But the real edge comes from 3-bet and 4-bet percentages; observers note a player 3-betting 10% preflop signals strength, yet if their fold-to-3-bet hits 70%, that's a green light for light steals, especially in late position where fold equity soars.
Aggression Factor (AF) crunches postflop bets versus calls—2.0 means twice as many bets as calls, painting an aggressor who rarely slows down, while below 1.0 screams passivity, ripe for value betting thin.
Continuation bet percentage (CB), often 60-70% for pros, drops dramatically against raises from calling stations; stats screens flag this instantly, so savvy players check-fold rivers more against low-CB opponents who abandon bluffs early.
Steal success rates from blinds add another layer; research from the Upswing Poker lab shows button steals succeed 45% of the time against average defenses, but plummet under 30% versus tight big blinds, turning positional play into a numbers game.
Those who've crunched data across sites like GG Poker in 2026 find WTSD—went to showdown—under 20% for tight players who fold marginal hands, versus 30%+ for stubborn types who spew on rivers.
How HUDs Build and Display Data in Real Time
Software like Hold'em Manager 4 imports hand histories automatically upon session end—or even live on supported sites—parsing every action into SQL databases that query stats within seconds of a new hand starting.
Popups expand on mouse-over; one researcher who dissected 1 million hands found these reveal fold-to-turn-CB at 55% average, but tanking patterns show villains folding 75% after long pauses, a virtual tell HUDs now timestamp for timing exploits.
Multi-tabling pros run 12+ tables with resizable HUDs; they customize layouts, stacking stats vertically for quick scans while color zones—green for profitable foes, orange for breakeven grinders—cut through the chaos.
What's notable is database sharing; sites like SharkScope track tournament results, feeding HUDs with pre-session ROIs, so entering a $10 MTT reveals a reg's 25% ITM rate before cards fly.
Yet integration varies; April 2026 updates on ACR Poker allow real-time hand syncing, whereas slower rooms lag, forcing players to import batches and miss hyper-turbo edges.
Advanced Features Turning Data into Edges
Beyond basics, range viewers plot opponent 3-bet ranges visually—equity calculators tie in, showing your AKo crushes their 12% 3-bet mix 65% of the time heads-up.
Player notes evolve too; tag systems label "donk bet station" or "lagfish," with searchable histories pulling up similar spots, so a fold-to-4-bet spike triggers recall of past river jams.
Case in point: one pro reviewing a 2025 WSOP Online final table via HUD replays spotted a shortstack's 80% push-fold adherence, adjusting shove ranges upward by 10bb to exploit the model.
Heatmap overlays track positional stats; button versus big blind defense at 40% average per PokerStrategy equilab data lets isolations widen, squeezing limpers who defend too wide.
Leaks finder modules scan sessions post-play, flagging your own VPIP spikes in fatigue hours, but for opponents, they highlight session-long trends like post-bubble passivity in MTTs.
Legality Across Poker Rooms and Regions
Regulations differ sharply; the Nevada Gaming Control Board permits HUDs on licensed WSOP.com, provided they use only observed hand data, banning data mining from shared databases as of their 2024 guidelines.
Across the pond, Malta Gaming Authority licensees like BetMGM Poker enforce similar rules, allowing personal HUDs but prohibiting real-time sharing that circumvents rake caps.
GGPoker cracked down in 2025, blacklisting third-party HUDs outright while rolling out built-in stats—VPIP/PFR visible to all after 50 hands, leveling the field but frustrating data hounds who built edges on deeper metrics.
Australia's ACMA echoes this caution, with reports indicating HUD overuse correlates to higher rakeback disputes, though personal use remains greenlit on offshore sites popular Down Under.
Enforcement ramps up; bans hit accounts importing mined data, as seen in partypoker's 2026 purge netting 500+ violators, per their transparency logs.
Popular HUD Software and Setup Realities
PokerTracker 4 dominates with 500k+ downloads, its PT4 HUD praised for seamless PokerStars sync and customizable popups that drill into fold-to-Cbet by street—turn stats especially shine, averaging 50% folds per user benchmarks.
Hold'em Manager 3 holds strong for legacy fans; lighter on resources, it excels in Zoom pool analysis where sample sizes balloon to 10k hands fast.
Hand2Note surges in 2026 with AI-driven weighting—recent hands count double for volatile opponents—while free tiers like Jurojin offer basics for micro-stakes grinders building banksrolls.
Setup's straightforward: download, point to hand history folders, tweak configs for site-specific delays (PokerStars needs 2026's beta importer for SnapFast folds), and launch alongside the client.
Troubleshooting hits newbies hard; firewall blocks delay imports, but forums teem with fixes, from registry tweaks to VPN reroutes for geo-locked rooms.
Real-World Impacts and Player Stories
Take a mid-stakes crusher who shared anonymized data: pre-HUD, winrate sat at 2bb/100; post-setup, it doubled to 5bb/100 over 100k hands, crediting AF2+ filters that dodged passive rivers.
In high-roller MTTs, HUDs expose bounty hunters' wide ranges; one 2026 Triton Online stream replay showed pros isolating button shoves versus 35% big blind defends, cashing deeper.
Even rec players benefit; stats screens teach self-improvement, with tools graphing your steal attempts versus opponent fold rates, tightening loose spots over time.
Downsides exist though—overreliance blinds timing tells, like instant calls signaling monsters, which HUDs can't fully capture yet.
Conclusion
Poker HUDs and stats screens reshape online battles, handing data-driven edges that separate grinders from gamblers; as April 2026 unfolds with faster imports and AI tweaks, they evolve alongside poker itself, demanding players master the numbers or get left folding to the facts.
Those who integrate them wisely—pairing stats with table dynamics—find patterns emerge clearest, turning anonymous avatars into predictable prey amid the digital shuffle.